
The Gantt Chart is the most commonly used project schedule chart – although it probably shouldn’t be. It is easy to create and to read. However, its major flaw is that it is based upon the assumption that all estimates of task duration are accurate. This assumption is often false, either because of the inherent uncertainty in the work, the vagueness of the requirements, or the unpredictable availability of resources.
 If you are not familiar with
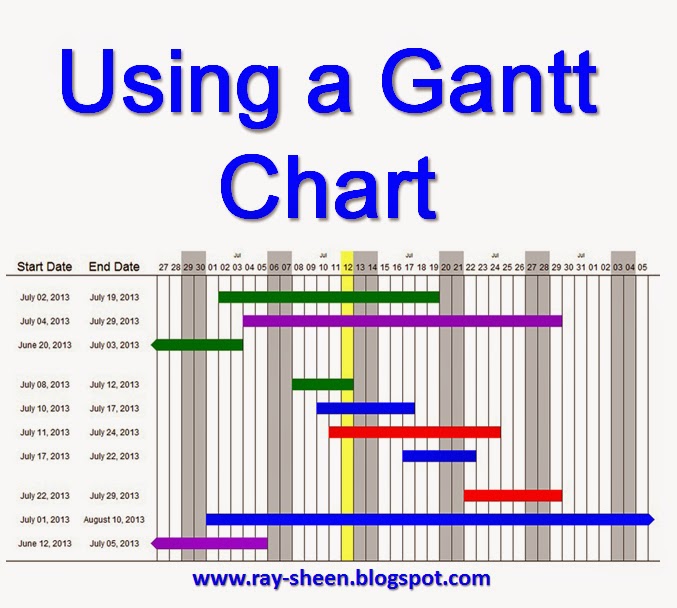
the term, the Gantt Chart (more properly called a Bar Chart) is a project
schedule tool that shows summary and detail tasks represented by horizontal bars
on a schedule timeline.
If you are not familiar with
the term, the Gantt Chart (more properly called a Bar Chart) is a project
schedule tool that shows summary and detail tasks represented by horizontal bars
on a schedule timeline.
It is appropriate to use a
Gantt Chart when the project task-level estimates are accurate and
precise. The Gantt chart format provides
a great schedule realization perspective for the project. It is easy to see what tasks the project team
should be working on each day, and it is easy to see if adequate progress has
been made by changing the color of completed tasks. When being used for tracking progress, I
always add a “time now” line on the current date of the project to indicate how
much progress should have been made.
Steps to Create a Gantt Chart
1. List
the project phases (Gantt Charts are often created one phase at a time).
2. Within
each phase list the summary level tasks and their associated detail tasks.
3. For
each task set the estimated task duration (use the units of the Gantt Chart
timeline).
4. Link
the tasks that must occur in the project in a sequential manner.
5. Either:
a. Starting
with the project start date and the first task, go forward in time plotting all
the tasks on the timeline based upon their linkages.
b. Starting
with the project end date and the last task, go backward in time plotting all
the tasks on the timeline based upon their linkages.
6. Record
the placement of tasks, the start date, end date, and duration on the timeline.
7. Insert
any risk mitigation changes, such as adding buffers.
8. As the
project progresses, change the color of completed task bars to show they are
finished.
Hints and Tips
·
The Gantt Chart is the easiest project schedule
chart to read and understand.
·
Start with a summary level Gantt Chart and
create detailed Gantt Charts for each phase.
·
Draw a vertical line on the timeline showing
“time now” and move the line along the timeline as the project progresses. It will show what work the project team
should be doing and you can easily track whether you are ahead or behind
schedule.
·
Different color bars can be used to show
additional information about a task, such as critical path, behind schedule, or
task is complete.
·
The Gantt Chart relies on accurate and precise
estimates for each activity. Using
inaccurate estimates sets false expectations because team members try to meet
the estimates, even though they quickly realize that some are wrong; and
stakeholders begin to doubt the credibility of the project team when the actual
durations are often different from the estimates.
·
The Gantt Chart cannot be created with variable
estimates. If you have that situation
either use a Network Diagram or start with the “most likely” estimate and build
in a risk buffer.
No comments:
Post a Comment