Wednesday, December 17, 2014

Tracking Project Performance with Spreadsheets

There are dozens of project management software applications available in the market.  But many project teams have found them either too difficult to use, or limited in their capability; so teams revert back to using basic spreadsheets or action item lists.  That’s OK!  When I am managing small projects, I normally do all my project performance tracking using a spreadsheet.

There is a project planning table or spreadsheet that is ideally suited for this and it is called a WBS Dictionary.  WBS stands for Work Breakdown Structure and is an organized list of all the tasks, activities and deliverables in the project.  It represents all of the “work” of the project.  I have no clue why the table is called a dictionary – you definitely don’t want to organize the project tasks alphabetically!
Let’s talk about how to create the WBS Dictionary and some of the uses.
1.     Develop your project plan using your normal scope planning, schedule planning and resource planning tools.
2.     Document the plan in the spreadsheet. First, create the column headings you will use for each of the project planning elements. There should be at least one column for the task description, normally at least two columns for the schedule – those being the start and finish date for the task, and at least one column for resources – either personnel or budget.  I will often have a second scope column which describes the quality criteria for task completion – the “definition of done.”  And I will sometimes include multiple resource columns such as estimates or the requirement for a tightly constrained resource.   
3.  Then add additional columns that will be used for managing the project.  There should be at least one column for current status.  Often I include columns for items such as risk factors, variance, or relationships with other tasks.
4.     Now organize the project work based upon how you intend to manage the project.  If the project will be managed by deliverables, organize the tasks and activities into groups that support each project deliverables.  If the project is managed in phases, list each phase and the deliverables for that phase.  Then organize the tasks into the phase categories.  If the project is to be managed by departments or functions, organize the tasks by the department responsible for leading or completing the task.
5.     Take your organized list and insert it into the spreadsheet.  Fill in the information for each column and each task.  (I often will create the spreadsheet columns and structure first, and then as I create the plan I document it immediately in the spreadsheet and don’t bother with any other planning tools.)
6.     As the project progresses, insert the status information into the appropriate cell 
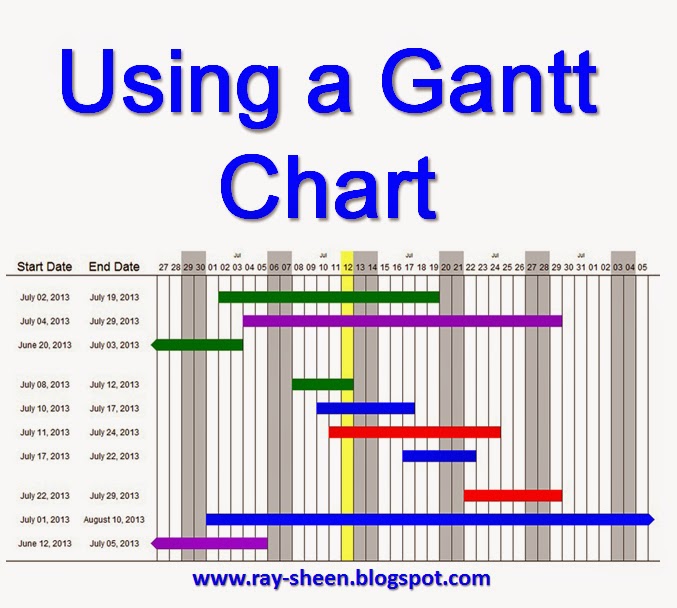
in the spreadsheet.  A technique that I often use is to “gray out” the lines that represent tasks that are completed and change the background colour to yellow for the tasks that are late.
7.     If there is a replan or update to the project, copy the spreadsheet into a new tab and give it a revision name or number.  Then update the project plan in the new tab and use the new tab for tracking status.  The old tab is then a historical record that you can use during Lessons Learned sessions at the end of the project.
8.     I share the spreadsheet with the entire team so that everyone can see our status and I run the team status meetings from the spreadsheet.     
When to use WBS Dictionary
Small/Focused Projects: The WBS Dictionary is an ideal tool for consolidating and communicating the project plan on small or focused projects.  The entire project plan can be presented in one table.  This minimizes the paperwork and documentation effort required.  In addition it is easy for everyone to follow and understand.

Large/Complex Projects: The WBS Dictionary is useful on large or complex projects for managing sub-projects within the larger project.  Examples of how I have used this are for summarizing a portion of the project such as a phase or tracking all the activities required to support a major deliverable.  The technique becomes unwieldy when the table grows to include hundreds of tasks.   


Wednesday, December 10, 2014

Layers of Project Management

I have often heard the complaint that if a project manager does all the project management stuff they are supposed to do, they won’t have time left to do the project.  I agree that applying all of the project management processes on some projects is overkill.  But the answer is not to ignore the project management processes, but rather to decide what aspects of project management will be most effective on your project.  Based upon project and organizational considerations, some aspects of project management should be emphasized and others de-emphasized.

I am going to divide project management processes into four layers of project management.  A rigorous and detailed project management approach will conduct a thorough application of project management processes in all four areas.  More likely, you will select one or two to emphasize and treat the other areas of project management lightly.
These are the four layers, or aspects of project management, that are applied to plan and control projects:
·         High-level project plan
·         Detailed project plan
·         Project risk management
·         Project control
A rigorous and robust project management methodology will diligently apply all four layers.  However, this will also take a great deal of project management effort.  Normally, based upon project constraints and organizational culture, one or two of the layers are emphasized and the others are only addressed lightly. 

Selecting Layers for Rigor and Emphasis

·         High Level Plan.  The high level project plan is quick and relatively easy.  Its strength is communicating the big picture to managers and stakeholders.  Its weakness is lack of detail.  Use this approach when there are many stakeholders and alignment is likely to be a problem.
·         Detailed Plan.  The detailed plan provides clear instructions and expectations to project team members.  Its weakness is that, when there are areas of high uncertainty, it must make numerous assumptions – some of which will be wrong.  Then when changing the plan for the correct status of the assumption, many team members becomes confused and frustrated.  Use this approach when there are many inexperienced team members and the work is well understood or defined.
·         Risk Management.  The project risk management layer emphasizes the uncertainty and unknown elements in the project and focuses on finding and responding to them.  The weakness with this approach is that the team is regularly “fighting fires” and the plan changes frequently to accommodate the risk response.  Use this approach when there are many high risk elements to the project or a high degree of project uncertainty.
·         Project Control.  The project control approach emphasizes pulsing and tracking project progress in real-time.  The weakness of this approach is that it feels like micro-management to the team because the project manager is constantly checking on them.  Use this approach on a very urgent project or when there is a limited or weak plan.
I have drawn the graphic of these layers as a set of concentric circles with gaps in them.  Even if you apply the project management processes of a layer in rigorous and robust fashion, it may still miss something.  And obviously if you only use a minimalist approach to one of the layers it will miss project problems.  The likelihood of project success goes up as the rigor of each later is increased, but also, the project management effort and bureaucracy will be increasing.  Therefore, the project team should decide, based upon the complexity of the project and proficiency of the organization and the team, which layers to emphasize. 

As I mentioned, I try to do at least two of them well – which two varies based upon the project.  And on large complex projects I will work hard at all four. 

Tuesday, December 2, 2014

Resource Over-Allocation

Project resource demands are often inconsistent throughout the life of the project.  There are peaks and valleys which often leading to times when resources are over-allocated.  Often project managers come crying to stakeholders about their resource problems.  Well let’s look at what causes this problem and what a project manager should do about it.

As all elements of the project plan are brought together, it is often found that the required resources for one task overlap with the needed resources for other tasks.  This cannot be determined until all the tasks have been estimated, resources assigned and the project tasks scheduled.  Resolving these over-allocations is often called resource levelling.  You can rely on project management software to find and fix these, but the software doesn’t understand the tasks, the people, and all of the options.  Instead, proactively manage these occurrences to ensure the best solution based upon the project goals and objectives. 
Or you may have developed the perfect plan and ensured that there is no resource over-allocation.  But then reality occurs.  A task is delayed and overlaps with other tasks.  Suddenly a resource that had excess capacity becomes over allocated. 
So what do you do?  When project planning is near completion, check for resource over-allocation. Project management software can help with this.  Whenever a project activity significantly changes schedule, either a delay or acceleration, check for resource over-allocation.
1.      For each constrained resource, analyse resource allocation. This is often done with a spreadsheet where the required number of hours or days of work for a task are assigned to the time period in which the task is to be accomplished.  This can also be done graphically.
2.      If over-allocated, First attempt to replan one or more of the tasks.  By isolating the resolution to one task, it has a minimal impact on the rest of project planning.  Things that could be done to replan a task is to change the assigned resource, change the “definition of done,” or change the timing of work within the task.
3.      If still over-allocated, change the project schedule using float. Change the timing of tasks that are using the over-allocated resource so that they some of them occur in times when the resource is under-allocated.  Do not reschedule critical path tasks, rather reschedule tasks that have float.
4.      If still over-allocated, request changes to project boundaries.  Go to stakeholders for permission to extend project schedule, descope the project, or increase the resources-usually leading to increased cost.  This is the last step after you have first taken the project management steps listed above.


Contingencies and Triggers

Projects are inherently risky activities.   The project team is creating a new capability for the organization.   Even if the project is just updating an existing capability, there are still uncertainties.  And that is the point of risk – it is uncertain.  If problems are known, they aren’t risks, they are project activities.  If problems are expected to occur, they should be addressed in the project plan.  If the problem is unlikely, the plan does not need to address it, but a contingency may be needed.  Let’s look at contingencies and the triggers that are used to implement them.

Contingencies
Contingencies are potential risk response actions that will only be implemented if some triggering event or condition has shown that the risk probability has gone from unlikely to likely.  When the risk analysis (qualitative and quantitative) has been completed, risks that are high impact but low probability should be addressed with a contingency.  The contingency is an alternate project plan.  The contingency is developed (at least the first few steps) for the unlikely condition when that risk does occur. 
This alternate plan normally has some detrimental attributes as compared to the normal plan (it costs more, it takes longer).  If the alternate plan was better than the normal plan, the project team should switch to the alternate plan immediately.  The detrimental attributes need to be acknowledged and if the contingency plan is implemented, the risk register will need to be updated to reflect any new risks that are a result of the contingency plan.
Triggers
In addition to developing an alternate plan, a project condition should be selected to act as a trigger indicator.  If the trigger condition occurs, it indicates that the risk has changed from unlikely to likely (or present).  When the trigger indicates that the risk in now likely, it is time to make a project change and implement the contingency plan
Triggers are routinely monitored by the project leader and Core Team.  These will be tracked at team meetings to see if they indicate the need to implement a contingency plan.  Effective triggers have these characteristics:
·               Appropriate for the type of risk
·               Timely to allow implementation of alternate plan
·               Discrete – a clear indication of the triggering event, no ambiguity

·               Documented  so that the team knows what they should be tracking

Monday, December 1, 2014

Value Creation Mapping

Everyone is talking about the importance of understanding the customer experience.  You may think your product or service is great, but if the customer experience is different from their expectations, you have a disappointed or possibly angry customer.  Recently, there has been a movement to “map the customer’s experience.”  I applaud this movement, and suggest that it goes when step further.
Too often the process improvement methodologies that are being used are internally focused.   They ask the questions, “How can I reduce my costs?”  “How can I improve my quality?” “How can I reduce my inventory?”  While the customer experience map will show us what the customer is doing, it does not ask the questions, “How can the customer reduce their costs?” “How can the customer improve their quality?” “How can the customer reduce their inventory?”
Customer experience mapping creates a graphical depiction of the steps that a customer goes through when attempting to buy or use a product.  It creates a process flow map that shows each step, each branch or decision, and the possible end-points – be they satisfied customer, disappointed customer, confused customer, or angry customer.  Analyzing this map will identify opportunities to improve the customer experience, and therefore customer satisfaction, with your products or services. This map is a powerful means for communicating to an organization the customer experience and can be the impetus for major changes in product or service performance.
One problem that I have seen with how this technique is often employed is to map only the customer steps and to ignore the steps on the part of the seller.  Just like ignoring the steps on the part of customer and only looking at your internal steps will lead to sub-optimization for the customer; only looking at the customer steps can lead to sub-optimization for the seller.  I believe you need to show both.  Then the impact of improvement decisions will be better understood.  However, while this focuses on process improvement it misses the opportunities to create value.
In my experience, there is another layer of information that can be added to the customer experience map that magnifies its importance.  This is when the map includes not only what the customer is experiencing, but also whether that experience is adding value for the customer.  This goes beyond just mapping “what” the customer does, it also maps “why” the customer does it.  And understanding the “why” will lead to important insights on how your product or service can be redesigned to make the customer’s job easier or productive.  That creates real value for the customer – and they will pay for that.
When our process improvement activities include improving both my outcomes and the customer’s outcomes, the process improvement becomes a value creation activity.   Religence, a customer relationship consulting practice headquartered in California, has fine-tuned their customer experience mapping technique to include these value creation tracking elements.  They, not surprisingly, refer to it as Value Creation Mapping. 

Products are a Commodity

Products are a commodity.  Sustainable competitive advantage cannot be achieved through products.  In every product category, there are large global competitors with similar technology, similar products, and similar features.  As a confirmed product development engineer, this is hard to admit – but its reality. 
Now products can be a competitive disadvantage.  If you have inferior product performance, poor quality, or the wrong features set for the target market segment, your product can hold you back.  But a superior product will no longer set you apart because there will be others there with their superior products.  A superior product does not win the game; it just allows you to enter the game.
So what does win?  Pricing?  Market access? Service?  All of those are important, but none of those are sustainable competitive advantages either.  There is always someone else in the market ready to match your pricing.  In today’s economy, there are hardly any major markets anywhere in the world that are protected.  You may need to have a local partner, but there is no trouble finding one of those.  Even service has become a commodity.  With global logistics systems, easy access to internet portals, and global user communities, service systems are no longer a competitive advantage.
However, what is still a competitive advantage is a strong customer-seller relationship.  This has been a competitive advantage for hundreds of years.  People buy products or services from those that they know and trust.  The personal relationship took a backseat to other forms of competitive advantage in the 20th century as products rapidly evolved and mass production lines transformed the quality, price and distribution systems.  But all of those are now equalized again and it comes back to relationship; but even that has changed.
Relationship in the 21st century has graduated to a new level due to the electronics and communication technology that is ubiquitous.  Customers want to be able to talk to sellers at any time on any topic through at least one of their numerous communication devices.   This is the new competitive advantage.  Creating and building a relationship with the customer – not just be the sales person, but by the whole company.  Marketing has a relationship with the customer to co-create new applications for products and services.  R&D has a relationship with customers to test product features and performance.  Operations has a relationship with customers to let them know exactly where their purchase is in the operations and logistics cycle.  Service has a relationship with the customer to inform them when their product needs maintenance or upgrades.  The sales relationship is becoming one of the least important to the customer.
So what does that mean for product development?  It means that products need to be designed with communications technology embedded within them.  And that supporting services need to be designed at the same time to provide real-time continuous customer relationship interactions with the product.  Not just at time of sale, but throughout the product lifecycle.  The product’s features and functions may be a commodity, but when the product also enables and fosters a strong real-time customer relationship it can lead to a competitive advantage.  


Why Special Cause and Common Cause Matter

There are many approaches to problem solving – 8D, Kepner-Tregoe, Six Sigma, Seven Step and Hypothesis Testing to just name a few.  A common goal of these methods is to get to the “root cause.”  Unless you fix the root cause, you are just treating a symptom of the problem and the cause remains to cause more problems.
But what is often over-looked is the nature of the root cause.  Is it a “smoking gun” where there is an unusual condition that is a direct link to the problem condition?  We often refer to this as a special cause.  Or is it a systemic problem that is caused by a several factors coming into an alignment that created the problem?  This condition is referred to as a common cause.  That nature of a successful solution is fundamentally different depending upon the answer to those questions. 
So before jumping to a solution to your problem, make sure you understand if it is a special cause or common cause.  The solution approach changes depending upon which type caused the problem.
Special Cause
Special causes are inherently unpredictable.  There are only two effective approaches to eliminate special causes.  The first is to avoid the conditions that can enable them.  For instance, if you find that a special cause problem occurred in a business process when you changed suppliers, don’t change suppliers.  If you can’t avoid the condition, then you need to put an “early warning” signal into your process so that you are aware when a special cause condition has occurred and you can quickly stop and contain the problem.  Let’s say you have traced a problem within a business process to a particular piece of equipment that failed to operate correctly and created several large batches of poor quality output.  You can put a monitor on that piece of equipment so that if it fails again, you are immediately notified and can stop the process and fix it.   
Common Cause
While special cause problems are unpredictable, common cause problems are totally predictable.  They occur when a system or process is pushed to provide an output that is better than what it is capable of doing.  The system or process may get lucky and occasionally deliver an acceptable result, but it is unable to reliably deliver that result.  When this is the nature of the root cause, the only options are to improve the system or go to a totally different system.  Both of these are often expensive and time consuming.  This condition often occurs when a system that was design for one purpose is used for a different purpose.  It may have performed satisfactorily in the initial pilot run when everyone was watching everything very closely, but it is not able to sustain good performance in normal operating conditions.
So why do we care whether it is special cause or common cause?  Well, doing a common cause system change to a special cause problem doesn’t prevent the special cause condition from happening again.  And doing a special cause change to a common cause problem will often make things worse since tampering with a system often reduces its reliability.   Special cause solutions focus on isolating and controlling the “smoking gun.”  They can be quickly implemented.   While common cause solutions require a system upgrade or total change in the business approach.

Telling a Story

To get your project approved, you often must first present a business case to the appropriate stakeholders.  The business case provides the business rationale, normally in financial terms, of why the project should be done.  But don’t let your business case be a dissertation on market statistics or a derivation of the net present value formula.  Instead, think of your business case as a story.
Let’s look at the plot, the setting and the characters for the story.  The plot is an adventure story.  It starts with some business problem to be solved or opportunity to be realized (project goal).  This problem or opportunity, when solved, will lead to a happy ending (business benefit).  To project team will need to overcome some challenges and hurdles along the way (risks).  The setting for the story is the business conditions (assumptions) and the project management methodology being used (constraints).  The characters for the story are the project team, the business management, and if applicable, key customers (all are stakeholders).   
With the story as a backdrop, build your business case using this four step process.
Step 1: Identify the business need or opportunity.
This step is usually done by the business unit who is the primary beneficiary from the project.  Typically the need or opportunity is either implementing an element of the business strategy or is driven by a problem or issue within the business. 
Step 2: Develop option(s) to meet the need.
This step is usually done by the organization or organizations that will conduct the majority of the project work.  For instance on a new product development project, step 1 may have been completed by marketing or product management, but step 2 will be completed by research and development or engineering.  At least one high level option is identified.  Multiple options may be identified.  If so, steps 3 and 4 will be done for each case and presented to the stakeholders along with a recommendation. 
Step 3: Estimate relevant cash flows.
Estimate all the project costs or expenses for each option.  Estimate the types of financial benefits for each option, such as cost savings or new sales.  Normally detailed project planning has not been done yet, so these are just rough estimates – one or two significant digits.
Step 4: Determine ROI and make a recommendation
Use the organization’s preferred Return on Investment (ROI) technique, such as breakeven, payback, NPV or IRR.   Your spreadsheet has formulas for calculating these.  Based upon the ROI calculation, make a recommendation as to whether project should be funded or not.  If there were multiple options, recommend your preferred option.
So let your business case tell your story – but be sure it is an adventure story, not a mystery, or worse yet a horror story.

Project Management Methodology: Helpful Guide or Bureaucratic Nonsense?

A methodology or system of project management helps those in the organization involved with projects to know what to expect.  The definition of best practices and templates will normally speed up a project and improve its overall quality.
A project management methodology is created by an organization to establish a pattern for a type of projects.  The key to whether the methodology is a helpful guide or bureaucratic nonsense is whether your project fits the pattern type.  If it does, you should follow the pattern or methodology.  If your project does not fit the pattern type, you should use the correct methodology or create a custom one for your project.  In my experience, a “one size fits all” methodology turns into a “one size fits none” impact.

So here are some suggestions for how to decide if a methodology is right for your project:

·         When assigned to lead a project, meet with stakeholders to understand the goals, objectives, and constraints on the project.
·         Based upon those meetings, determine if your project fits the criteria of an established project management methodology in your organization.
·         If so, follow the methodology.
·         If not, determine if you project fits the criteria for a well-documented industry-standard approach.
·         If you have access to that approach, follow it.
·         If your project does not fit an established methodology, you will need to spend additional time and effort in the project planning and project control aspects of project management since there will likely be confusion about what should be done and how to do it.
If you have been tasked with developing your organization’s methodology, here are some suggestions:
·         To develop a methodology, consider industry best practices for the type of project and examples of that type of project in your organization that went well.
·         Do not automatically adopt the best practice written about in books or on blogs.  There is a culture that must accompany any methodology for it to be successful.  If your organization is a “hero-based” culture, don’t adopt a methodology that requires strict process discipline.  If your culture is data driven, rely on analytical project management approaches, not one that require extensive team meetings and integration activities.
·         For a methodology to succeed, senior management must understand the methodology and how they are to interact with projects.  Senior managers who routinely direct the project teams to do things that violate the methodology will ensure that the methodology is not followed.  If senior management wants to change the methodology, change it.  It is better to have an imperfect methodology that is followed than no methodology at all.
·         A Project Management Office (PMO) is often needed to ensure that the methodology is both kept current and that it is followed.  Many methodologies require elements of program or portfolio management and a PMO is almost always needed to for that level of project management planning and control.  

Six Sigma Suppresses Innovation

The Six Sigma movement has made impressive contributions to business performance.  Both at the product and process level we have seen dramatic improvements in cost, quality, and cycle-time.  Business decisions are becoming more data-driven.  Poor performance is not tolerated.
But one area where Six Sigma has not helped is innovation.  And that is because innovation is antithetical to the whole philosophy of Six Sigma.  The organizing principle of Six Sigma is to find and remove variation.  Consider the five steps of Six Sigma: Define, Measure, Analyse, Improve, and Control.  Define is focused on setting the standard. Measure determines the current performance.  Analyse determines whether the performance meets the standard and if not, why not.  Improve changes the standard or performance until the variation is minimized.  Control introduces a system to ensure that performance doesn’t change.
Innovation, especially break-through innovation, is incompatible with the Six Sigma philosophy.  For starters, the Define step cannot define a standard for something that does not yet exist.  Next the Measure step is unable to adequately measure performance that is undefined.  With no standard and an undefined performance measurement, the Analyse step is meaningless.  So what happens in the Improve step is that performance is driven back to the old known standard, which squeezes out the innovation.  And the Control step ensures that innovative performance is not allowed back into the product, service or process.  Add the rigid DMAIC process discipline to this and all attempts to try something different and new are not just curtailed, they are punished.
Even the Design for Six Sigma (DFSS) technique seldom leads to innovation.  This approach starts with defining the desired customer experience.  But customers can’t define an experience for innovative product or service because they have never experienced it yet.  So customers define enhancement to existing products and services.  This may lead to small incremental improvements, but not break-through innovation.   The rest of the DFSS methodology will impose the rigid Six Sigma discipline on the development of these minor improvements and ensure high-risk breakthrough innovation ideas are squashed.
So what is the answer?  First, don’t even think about imposing Six Sigma on R&D or product development processes.  If you want some control and discipline, use a Stage-gate or Agile approach to project management and use road-mapping to guide your research efforts.  While these approaches don’t ensure innovation, at least they do not prevent it. 
The time to bring in Six Sigma is at the time of detailed design or transfer to production.  By then the concept has been shown to be feasible.  Often there have been several demonstration models or prototypes created.  It is possible to now set standards and begin to measure performance around the innovative concept.  The customer or user can define their desired performance level with the innovative product or service.  Now the Six Sigma discipline starts to make sense and it can actually aid in ensuring the quality of the start-up of the new product or service.

Using a Gantt Chart

The Gantt Chart is the most commonly used project schedule chart – although it probably shouldn’t be.  It is easy to create and to read.  However, its major flaw is that it is based upon the assumption that all estimates of task duration are accurate.   This assumption is often false, either because of the inherent uncertainty in the work, the vagueness of the requirements, or the unpredictable availability of resources. 

If you are not familiar with the term, the Gantt Chart (more properly called a Bar Chart) is a project schedule tool that shows summary and detail tasks represented by horizontal bars on a schedule timeline.
It is appropriate to use a Gantt Chart when the project task-level estimates are accurate and precise.  The Gantt chart format provides a great schedule realization perspective for the project.  It is easy to see what tasks the project team should be working on each day, and it is easy to see if adequate progress has been made by changing the color of completed tasks.  When being used for tracking progress, I always add a “time now” line on the current date of the project to indicate how much progress should have been made.

Steps to Create a Gantt Chart

1.      List the project phases (Gantt Charts are often created one phase at a time).
2.      Within each phase list the summary level tasks and their associated detail tasks.
3.      For each task set the estimated task duration (use the units of the Gantt Chart timeline).
4.      Link the tasks that must occur in the project in a sequential manner.
5.      Either:      
a.       Starting with the project start date and the first task, go forward in time plotting all the tasks on the timeline based upon their linkages.
b.      Starting with the project end date and the last task, go backward in time plotting all the tasks on the timeline based upon their linkages.
6.      Record the placement of tasks, the start date, end date, and duration on the timeline.
7.      Insert any risk mitigation changes, such as adding buffers.
8.      As the project progresses, change the color of completed task bars to show they are finished.

Hints and Tips

·         The Gantt Chart is the easiest project schedule chart to read and understand.
·         Start with a summary level Gantt Chart and create detailed Gantt Charts for each phase.
·         Draw a vertical line on the timeline showing “time now” and move the line along the timeline as the project progresses.  It will show what work the project team should be doing and you can easily track whether you are ahead or behind schedule.
·         Different color bars can be used to show additional information about a task, such as critical path, behind schedule, or task is complete.
·         The Gantt Chart relies on accurate and precise estimates for each activity.  Using inaccurate estimates sets false expectations because team members try to meet the estimates, even though they quickly realize that some are wrong; and stakeholders begin to doubt the credibility of the project team when the actual durations are often different from the estimates.

·         The Gantt Chart cannot be created with variable estimates.  If you have that situation either use a Network Diagram or start with the “most likely” estimate and build in a risk buffer.

Scope Creep

Scope creep is the uncontrolled expansion to project scope without adjustments to time, cost, and resources.  It is a characteristic of many projects – and it always leads to problems for the project team.  When work changes, but boundaries don’t, either something needed doesn’t get done, or the boundaries start an uncontrolled shift.

Scope creep can occur at any time in the project.  It most commonly occurs during reviews with stakeholders or customers.  During the review, the stakeholder or customer requests a change to a project goal or deliverable that will require additional unplanned work.  The project goal or deliverable is changed without adjusting the project schedule or resources.  
But don’t blame everything on the stakeholders.  Scope creep can also occur when project team members add unnecessary work to the project.  Often the team members do this because they believe it will make the project results better.  However, if the stakeholders have not agreed to the change and provided additional time and resources, the effect is to cause scope creep.
Scope creep inevitably leads to delays and overruns since the extra work requires time and money to complete.  Often scope creep is not recognized until the delay or overrun has already occurred.  At that point it is too late to prevent the scope creep.  The project must either be “de-scoped” to fit within the original boundaries or the delay and overrun absorbed by the project sponsors.

Five steps to control Scope Creep

1.      Managing scope creep starts at the time of project initiation.  A clear set of project boundaries will reduce the likelihood of project scope creep.  To clarify the boundaries, I suggest that a list of potential activities that are not needed on this project be listed and signed off at the time of project initiation.  Two lists, one of what is in and one of what is not in the project will sharpen the boundary.  
2.      Create a small reserve of time and resources during project planning to be able to absorb small scope creep perturbations.  Allocate a portion of this to each phase of the project.  Some organizations refer to this as management reserve.
3.      The Project Leader should guard against scope creep initiated by team members at the regular team meetings.  If a task completion is delayed, the Project Leader should immediately check for the possibility of scope creep.  If that is occurring, the Project Leader and Core Team member should redirect the task leader to stay within the task scope.
4.      Following every meeting with stakeholders, the project team should review the action items and direction to determine if there is scope creep.  If there is an unfunded request for additional scope, the Project Leader should notify the stakeholders and request a clarification on project boundaries.  Either an increase in time and resources, or the removal of the scope direction.
5.      Scope requests that are not approved by the stakeholders should be recorded on a list known as the “Scope Creep Parking Lot.”  If the project is rebaselined, this list should be reviewed and appropriate tasks added to the project.   At the end of the project, this list is turned over to the project sponsors for review by future projects.